Moneyball for CMs
Moneyball for CMs

“Adapt, or die,” Billy Beane, the general manager of the Oakland Athletics, once said. That quote was immortalized in the 2011 movie Moneyball, when Brad Pitt played Beane. This fantastic film recounts the story of the Athletics’ 2002 season and how, after losing three of his superstar players to the Yankees and the Red Sox, Beane faced the daunting task of replacing this talent for the upcoming season. The movie roughly recounts how Beane responded, and how, in the process, he revolutionized how major league general managers analyze baseball statistics.
This story can be a window into how component manufacturers (CMs) should look at their businesses and perhaps revolutionize their financial results. If you are not familiar with SBCA’s Financial Performance Survey (FPS), you need to be. No matter what your business is, whether you own a major league baseball team or you’re managing a component manufacturing facility, you’ve got to know your numbers! I hope I can convince you why it makes good business sense to participate in the FPS by illustrating what you can get out of it.
The best part about the FPS is it looks at the appropriate statistics. One of the funniest scenes in the movie Moneyball is when Billy Beane is meeting with his scouting staff during a player evaluation session. The veteran scouts are describing players’ abilities in authentic baseball gibberish: one player has a beautiful swing and looks good in his uniform; one player has all the “tools”; one player lacks confidence because his girlfriend is a “6.” Finally, exasperated, Billy Beane walks out of the meeting. The next scene is the most important for us. Billy turns to this young baseball statistician he has just hired and asks him for advice. This rookie kid with absolutely no athletic ability begins to explain his theory of baseball analysis. He tells Billy that owners and managers have been looking at the wrong numbers in baseball forever: “We are not trying to buy players, we are trying to buy wins, and in order to do that you have to buy runs. Many valuable players are overlooked because owners and managers are looking at the wrong numbers.”
The FPS survey is completely anonymous!
You won’t be broadcasting any bonehead moves you made the year before, although we’ve all made them. What this means is all of your company’s financial results are completely confidential. No SBCA staff or CM members will
ever see your numbers.
Here’s how the survey works:
- You input your financial results (sales, expenses, inventory, receivables etc.) into the FPS online survey questionnaire.
- You submit the survey to SBCA’s third-party accountant who then compiles all the information, removing any details that would associate specific data with a specific company.
In talking with many of the CMs who participate in the survey, they tell me it takes about two hours per manufacturing facility to enter all the information. The CMs who do it year after year say it’s a breeze after you’ve done it once. Most importantly, the consensus I got after talking with many of the previous participants is the time investment is well worth the effort!
Without getting too much into the weeds of baseball sabermetrics, the lesson is that success comes through looking at the right numbers. The FPS survey does this better than anything else CMs have at their disposal!
Component manufacturing is a tough and competitive business – just like major league baseball. Like it or not, we are all competing with each other on a daily basis. However, the competition can be fun and even exhilarating, especially if you can visualize your progress using the same scorecard everyone else is using. The FPS is that scorecard! The FPS will help you to compare your results with your competition.
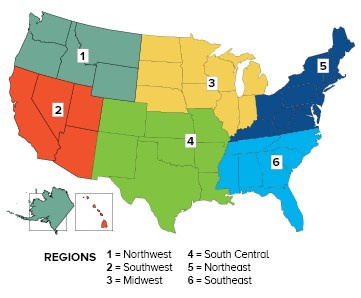
The survey results are broken down into six regions of the country, so you can compare what you are doing with everyone else in your part of the country. The survey results are also broken down by company size; again, you can compare your business with all the CMs who are about the same size. The results are also organized around the numbers in the middle 50 percent of the results. You can see the financial performance of the companies in the top 75th percentile, as well as the companies in the bottom 25th percentile. This is a great way of looking at your company’s performance in an extremely relevant way; that is, companies similar to your size and in your part of the country.
FPS Step by Step
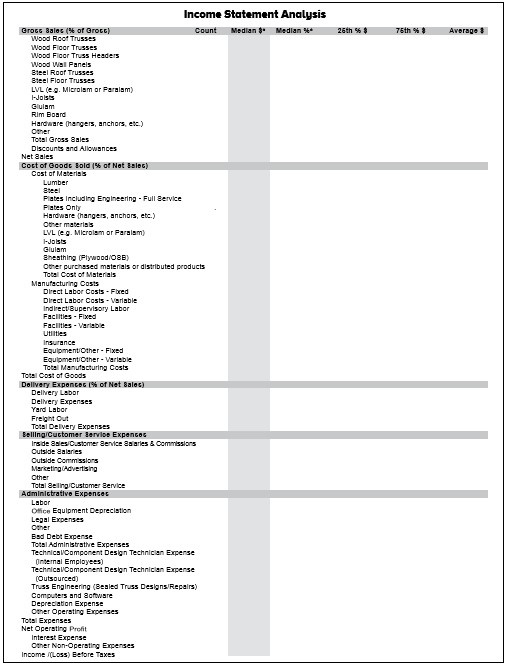
The first part of the FPS survey shows the income statement analysis. You can look at sales results, gross profit margin, and cost of goods sold, as well as all your expenses including delivery, selling, and administrative. You can see plainly were your numbers stack up against the top performers in your area as well as those who are not doing as great. My guess is that you will find areas in this part of the survey that your company may compare quite favorably and in other areas not so much. But that’s ok! That’s the main reason why you should participate in the survey. Areas that your company may need to improve upon will be clearly evident, and areas where you compare well confirm that you are on the right track.
In the Financial and Operating results section, you can really focus in on the relevant operating metrics that other CMs are looking at across the country. There are four categories in this part of the survey: asset performance, gross profit, personnel productivity, and material productivity.
Let’s start with asset performance. Here the survey takes a deep dive into fixed asset performance, average collection period, and inventory turnover. Fixed asset performance simply takes your total sales for the year and divides them by your property plant and equipment. What we want to understand here is how our tangible assets are generating sales. Let’s say, as an example, I’m looking at the survey page for companies with sales under 5 million. The fixed asset performance ratio for the companies in the 75th percentile was 20.7 and the fixed asset performance ratio for companies in the 25th percentile was 2.8. The average fixed asset performance ratio for companies in this group was 14.1. What I think is great about this survey is you can locate your company along this spectrum to evaluate how your company is using its plant and equipment in comparison to other companies your size.
The other two crucial ratios in this section are average collection period and inventory turnover. These two numbers are what I consider Moneyball ratios. You must collect your receivables and you must manage your inventory or you will not stay in the game! I would say that for the metric, average collection period, any number close to 30 days is good. On the inventory turnover ratio any number near 12 times is good. One good way of looking at these numbers is to visualize your company buying material and fabricating it into trusses, then delivering to the jobsite, and then collecting the money all in a 60-day cycle. That’s winning! Though it’s much easier said than done. The great thing about the FPS is you can see how your peers are doing it and what numbers you should be aiming for going forward.
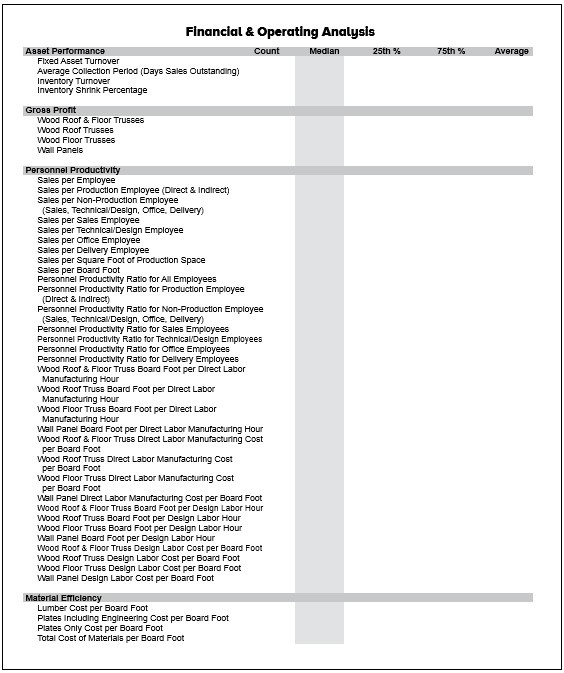
Gross profit is the next section of the FPS, and it is eye opening! You can compare your company to other CMs similar in size to see what profit margins they are achieving in roof trusses, floor trusses, and wall panels. Pay close attention to these numbers and see if you are playing in the major leagues. It’s a lot like having a 90 mph fastball for a pitcher. If you don’t have it, it will be very difficult for you to win games.
The next section in the survey is the personnel performance ratios, which provides 32 different metrics for comparison. The point is that you do not want people who just, “look good in their uniforms.” I especially like the sales ratios here because I’m a sales guy. The first number here is sales per employee. This number gets to how your “team” compares to other teams in your league. There are 31 other metrics to review here, so there are a lot of ways to evaluate the personnel performance in your company.
The last section of the FPS includes material efficiency numbers. Now, I admit I love the sales numbers more than anything. To me sales are like hitting and putting up runs – you can’t win if you don’t score runs. However, the material efficiency ratios are like pitching, and as much as I hate to admit it, great pitching always defeats great hitting! Just ask Stephen Strasburg, the 2019 World Series MVP, if this statement is true (Go Nationals!). The material efficiency ratios really zone in on how well you are buying your lumber and plates. The cost per board foot ratio and the steel plates per board foot ratio are definitely Moneyball numbers! You really need to pay attention here. Get close to the CMs in the 75th percentile in this category and you will consistently win.
Everyone’s a Little Different
One word of caution here: I want to emphasize that every company is different. Your business model, your product mix, and your debt structure all play a huge role in how you will use the numbers in the FPS to compare with your own results. Let me also add that I spoke with many CMs in doing my research for this article and every single one of them got tremendous value out of participating. In the 2019 FPS we had 108 CMs who participated, which is about 18 percent of our current SBCA CM membership. We can – and must – do better than that. The more members that participate in the FPS survey, the more accurate and useful the data will be for everyone in the industry because it reduces the impact of outliers, either at the top or bottom.
One final note, Billy Beane would argue that Babe Ruth was the greatest baseball player in history. Never mind the 60 home runs in a single season or the 714 homes runs in his career (both marks were surpassed). Babe Ruth’s career OPS (i.e., on base % plus slugging %) number was 1.1636. OPS is the most Moneyball number of them all for hitters in that it measures not only the ability of a player to get on base every time they get up to bat (on-base percentage) but also how many “extra” bases (slugging percentage) that hitter gets when they get a hit.
In the Major Leagues today, the best hitter in baseball each year may end up with an OPS near 1.0. Compare that to an entire career averaging well above that. The point is that, while we may know Babe Ruth was a great baseball player, the numbers help us quantify and compare his greatness against everyone else who has ever played the game.