In the Eye of the Beholder
In the Eye of the Beholder
Editor’s note: This article is intended to be an introduction to a forthcoming series of articles by the author. It establishes a vocabulary of financial terms and methods that will be used in future articles and seeks to ensure everyone has the same foundation of knowledge.
As a component manufacturer (CM) owner or manager, it is only human nature to want to know how you stack up against your competitors in terms of performance and profitability.
You are probably well aware if you are currently profitable or not, but are you as profitable as you could be, and what areas could stand improvement? Are you as profitable as the other component manufacturers in your market? How does your degree of profitability (profit as a percent of top-line revenues) affect your company’s value in the event you were to seek an acquisition, recapitalization, or employee or family buy-out?
A key term used in this article is “EBITDA.” EBITDA is a Generally Accepted Accounting Principles (GAAP) term for the company’s Earnings Before Interest, Taxes, Depreciation, and Amortization.
The challenge in making this kind of comparison with another company is clear: How do you find another business like yours in size and product mix in your market to make the comparison meaningful?

Let’s take a hypothetical CM with a $20 million revenue operation. If that CM could find another nearby component manufacturer with the same equipment, also doing $20 million in business (and that wouldn’t mind opening their books), the two companies could talk and get a clear idea of how they are each doing.
But the chances of that really happening hover somewhere near zero.
How about if a CM calls another CM outside of their region? This happens quite a bit amongst companies who actively participate in SBCA and don’t compete with each other. But this approach doesn’t get an “apples-to-apples” comparison either, even if the CM had roughly the same sales revenues. Differing regions bring different challenges (labor, trucking, material costs, distribution strategy, access to roadways, etc.).
Apples-to-Apples Comparisons
There is a way to compare one company to another, even when they are dissimilar in sales revenue, with the caveat that the companies involved should be roughly equal in terms of their scale, technology, and equipment in use. For example, a roof truss manufacturer booking $6 million a year, cranking out standard 8/12 16-foot-long gables with no customization, is of no comparative value to a diversified production/custom shop with automated saws and laser-guided layout tables. So, be sure to pick a business that is at least the same “species” when doing a comparison.
A key to determining a truly comparative performance is to look at the key performance indicators (KPIs) of your company, and those of the company you want to size-up, much as an outside acquirer would view them. The KPIs that an acquirer uses are instructive “tells” of a well-run operation. By using them, an apples-to-apples look can be achieved, or very nearly so. While doing so, keep in mind – and this is central to any KPI analysis – that companies are acquired for their cash flow but valued based on their EBITDA percentages. We will look at the pricing implications of this below.
Companies are acquired for their cash flow but valued based on their EBITDA percentages.
The central KPIs to focus on are Sales Revenue; Cost of Goods Sold (COGS); Gross Profit (GP dollars); Gross Profit Margin (GPM) by customer at least for the top 20 customers, by volume; Operating Expenses (OPEX); and EBITDA.
A central part of achieving this acquirer’s view is to generate financial statements that express performance in dollar figures but also what percent the dollar figures represent of the sales revenue. When an acquirer is reviewing the financial statements of a potential seller, they track percentage expression of KPIs on a quarterly and annual basis, both projected and reaching back over time, as a key part of their analysis:
- On the Sales Revenue line, they are looking for growth percentage, quarter-over-quarter and year-over-year.
- On the GPM line, they are looking for GPM percentages that improve over time, and they will examine the underlying reasons for any increase (or decrease) in GPMs.
- On the OPEX line, an acquirer is looking very carefully at operating expenses as a percentage of sales. As sales increase, OPEX as a percent of sales should decline, resulting in improved EBITDA margins.
SBCA’s FPS provides financial and operating information presented in an income statement format, along with key data for use in evaluating your company’s sales and benchmarks. Visit sbcindustry.com/surveys for details.
Each of these KPI metrics play a critical role in the performance of the business, but why present them as percentages? Let’s look at a quick example: When comparing one hypothetical company to another, assume one does $20 million in sales with $5 million in EBITDA, and another does $26 million with $6.3 million in EBITDA.
Expressing EBITDA as a percentage makes the performance comparison meaningful. The $20 million company can report that it made a 25 percent EBITDA margin (the formula is $5M/$20M=25 percent). The $26 million company can report that it made a 24.2 percent EBITDA margin (6.3/26). These two companies, dissimilar in terms of revenue, are performing at about the same EBITDA percentage. They may be doing the same things wrong, but they are certainly doing the same things right.
Let’s look at another example where the companies’ reports are far apart: If a $25 million company reports $2 million in EBTIDA, and the $30 million company reported $7 million in EBITDA, then the comparison is even more telling.
The $25 million company (2/25=.08) is operating at a very low, eight percent EBITDA margin – indicating something is wrong – while the $30 million company’s EBITDA margin, with the $7 million in EBITDA, is cranking along at a healthy 23 percent EBITDA margin (7/30=.23), well within the swim lanes nationally for a well-run CM.
Here we have two companies around the same revenue, with vastly different EBITDA performance. Which one would you want to acquire? You certainly wouldn’t base the value on sales revenue. You’d base it on EBITDA performance as a percent of Sales Revenue.
Expressing Percentages for Other KPIs
The same principle explained above, which generates percentages rather than dollar figures for comparisons between companies dissimilar in size, can be performed for other KPIs, such as COGS, Gross Profit dollars, GPM, and OPEX.
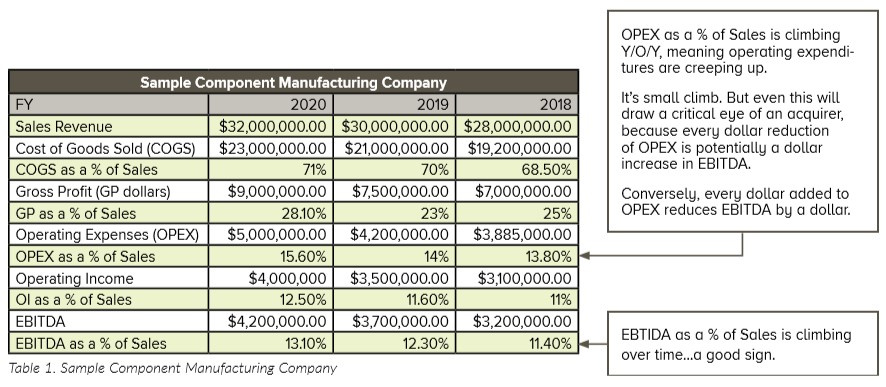
Let’s take a closer look at each, assuming a hypothetical company has $32 million in sale revenue.
COGS and GP: For our example, assume that this $32 million revenue company has $23 million in cost of goods sold (COGS). That means that the company has generated a gross profit of $9 million.
Now, if one CM called another and said he had a gross profit of $9 million. That might sound impressive, until he also confessed that the $9 million in GP was generated on $50 million in sales. That would make the $9 million look terrible in context, with just an 18 percent GPM performance. But if you know the sales are $32 million, and the COGS are $23 million, then your $9 million GP represents a 28.13 percent performance. That’s the KPI you use to compare yourself to other companies that are of the same species. While you’re working on this data, calculate your Gross Profit Margin for your top 20 customers and see if you are maintaining “GPM discipline” and not overly discounting even for your highest volume accounts.
OPEX: Now, let’s calculate operating expenses as a percent of sales. For our example, let’s assume you have $5 million in OPEX. If you have $5 million in OPEX, then your OPEX percent is calculated by dividing the OPEX by the sales revenues (5/32) to get 15.6 percent.
Operating Income: Subtract OPEX from the GP and you get operating income as a dollar figure. Then convert it to a percentage. In our example, the gross profit is $9 million and the OPEX is $5 million. So, the operating income is $4 million, or 12.5 percent of the sales revenue. From there, your EBITDA can be readily calculated.
EBITDA: EBITDA is the company earnings before it pays interest, taxes, depreciation, and amortization; whereas operating income expresses the profit of the company after paying the operating expenses. Once you calculate the EBITDA (and in our example, it will depend on the idiosyncrasies of this hypothetical company’s taxes) it will be around $4.2 million.
Since the sales revenue is $32 million, and the EBITDA is $4.2 million, the EBITDA margin is 13.1 percent.
Why EBITDA Is King
As important as the EBITDA expressed as a dollar figure is, the EBITDA percentage is more telling. It is the clearest expression of what portion of the Sales Revenue makes it to the EBITDA line. The EBITDA percentage is the gold standard for how well-run your company is, no matter its size. As stated earlier, companies are acquired for their cash flow but valued for their EBITDA percentage. A company that has 13.1 percent EBITDA performance from our example above will be valued lower than a company that has EBITDA performance around 20 percent. The 13.1 percent performer might get a 5X EBITDA as a company value for acquisition, and the 20 percent performer might be at 7X. This difference can be extremely impactful. With a $4.2 million EBITDA, the 5X values the company at $21 million while the 7X values the company at $29.4 million.
With the acquirer’s view obtained through expressing these KPIs as percentages, anyone – inside or outside the company – can obtain a clear-eyed picture of its performance and have the financial vocabulary to compare itself instructively to others.
(1stWestMA.com), which has a specialty practice in component manufacturing.